|
Dave Harris MacPherson showed widespread commitment to the goal of racial equalities so developing an educational agenda is clearly a priority, institutional racism was raised as an issue but there is confusion. An early Ofsted report suggested that most LEAs lacked clarity and direction despite having equal opportunity policies and less than 1/4 of them had a clear strategy [1999 Hansard report]. This report draws on new evidence trying to evaluate the relative significance of race against gender and social class, using official data and material based on the Youth Cohort Study (YCS) of England and Wales. The focus is on the principal minority ethnic groups as in the last census — Black Caribbean, Black African, Black other, Indian, Pakistani and Bangladeshi which account for 80% of the minority ethnic population. They have not included Gypsy and Traveller communities because there was a separate project on them. They did not include Chinese because the numbers were generally low and anyway they were the most likely to attend independent schools. They use the term African Caribbean for people of Black African and/or Black Caribbean heritage because these were terms that 'would be acknowledged and supported by the people so labelled' (6). Equality of opportunity is important but racial equality has only been of marginal significance compared to social class and gender, until now. It is now 'widely understood that society as a whole there is a social and economic cost by being deprived the fruits [sic] of their enterprise, energy and imagination'. Only a minority of primary schools and virtually no secondary schools 'can accurately claim to be "all White"' and 'it is inconceivable' that any pupil could live their life without meeting not being affected by people from different ethnic backgrounds. The original White paper 'Excellence in Schools' (1997) committed the government to equality of opportunity and high standards for all, in order to avoid isolation and social exclusion. Underachievement is often assumed to lie with pupils and families, and this sometimes becomes a stereotype, sometimes 'a pervasive "discourse of despair" among and about ethnic minorities' (7). There are differences in average achievement between social groups which are concerning but they do not 'in themselves prove anything about the potential of those groups'. The reasons are multiple, patterns of inequality 'are not fixed'. Groups like African Caribbeans may be ranked poorly in national measures, 'but the same group can be doing relatively well in some schools and in some LEAs', so we should take care not to assume an overall hierarchy, or to identify 'either "model" — or "deficient" ethnic minorities'. For example in one LEA, Bangladeshi pupils emerged 'as the highest attaining group of all'. Much useful data has been gathered as a result of the new Ethnic Minority Achievement Grants (EMAG) which require data to be submitted and provided a comprehensive database. However the data were limited, for example in maintaining the anonymity of LEA's, and variations in the data they submitted: in particular, raw numbers were not always provided and sometimes percentages will 'refer to very small groups locally'. The data relates to pupils attaining at least five higher grade GCSEs. Ethnic classification is also varied, but it was possible to compare them using the official categories [how often?]. Several combined all-Black groups under a single heading, others used different ranges [bloody careless!] Several could not give a figure for minority attainment in year 11, and almost 1/3 of them did not record current GCSE attainments by ethnic origin [at all?], So ethnic monitoring is 'still not a universal feature'. [What data there is] show that White pupils are the highest achieving groups in 5% of the LEAs that did monitor, and second highest in a further 32%. There are 7% where White pupils are the lowest attaining. However, this 'almost certainly underestimates the true level of White attainment because those authorities that do not monitor by ethnicity and those that did not bid for EMAG support… are likely to be among those with the least history minority settlement… [And]… Also… Places where White pupils enjoy relatively high attainments' (9). For each of the main ethnic groups, 'there is at least one LEA where that group is the highest attaining'. We have to remember that this is a measure 'relative to other groups' but it is encouraging. There might also be small numbers only involved. But it is significant and reminds us of the variability of attainment, and that 'all can achieve' [also means that there is no systemic racism?]. Focusing on the relative attainment of African Caribbean pupils is not easy, 'because several authorities use composite categories', some record three Black groups, some two, some only one. But if we compare Whites attainment and all the recorded Black groups in each L EA, we find that in 11% of them returning suitable data, White pupils were less likely to obtain five higher grade GCSE grades than Black pupils in each of the categories listed by the LEA . The reverse was the case in 42% of the L EA's, however where none of the Black categories match the attainment of White pupils. This shows 'the situation is more complex than usually supposed, but one still characterised by inequality of outcome' [by no means systemic and constant racism!]. It certainly shows that 'Black pupils are capable of high achievement. In one of 10 authorities that monitor GCSE results by ethnicity, pupils in all recorded Black groups are more likely to obtain the benchmark than their White peers. However there is still a picture of marked inequality elsewhere: there are almost 4 times as many L EAs where the picture is reversed' (10). Previous Ofsted research showed that Indian pupils were the highest performing of the South Asian categories and were achieving levels of success better than White counterparts in some but not all urban areas, since confirmed by the Youth Cohort Study (YCS). EMAG data shows they are more likely than White people to attain five higher grade GCSEs in 83% of authorities monitoring by ethnicity and this is 'a highly significant pattern'. Having English as an additional language 'is not an impenetrable barrier', especially as a recent survey suggests that a majority of all British Asians speak a non-European language, despite an increasing frequency of English among the young. Pakistani pupils get lower average results than their White peers at age 16 although again EMAG data suggests 'considerable variation between different authorities, and in 43% of those suitable ones they were more likely to attain at least five higher grade GCSEs than their White peers, although less likely at the national level. Bangladeshi pupils were seen as suffering the most disadvantages is of relatively recent settled group with 'comparatively low levels of English language fluency. However by the 1990s they were already showing dramatic improvement at least in London, where 1/4 of them are educated, and they were attaining higher average exam scores than their White pupils by 1991. YCS data suggest that this is improved 'substantially in recent years'(11). EMAG data shows that this is not limited to London, and although they might still lag behind White people nationally, there are 'at the local level… Many cases where this pattern is challenged'. So overall data from the EMAG shows quite a lot of differences in performance across L EA's and there are general messages. First 'clear grounds for optimism' because there is at least one authority where each minority groups attain higher than the other groups, although we must remember the limitations of the data. In other words 'no ethnic group is inherently less capable of academic success'. Nevertheless, 'inequality of attainment is a significant and persistent problem for many minority ethnic groups' so that 'in the majority of cases White attainment was higher than that achieved by most of the separate Black cases: in 4/10 cases the White group attained higher than everyone of the categories used to classify Black pupils locally. Similarly, Pakistani and Bangladeshi pupils lagged behind their White peers in the majority of the submissions'. EMAG data does not allow us to gather systematic data on differences based on gender or social class background, and it only gives one year returns, so we need additional survey research. DfEE data shows a dramatic improvement in pupils completing their schooling with five or more GCSE higher grade passes from 33% in 1989 to 48% in 1999. This is overall, not broken down by ethnic origin. We do know about gender, for example. YCS also gives us data about gender and shows that 'members of each principal ethnic group are now more likely to attain five higher grades than ever before', although there are still 'considerable differences in attainment' between them so they do not 'experience equal educational opportunities'. White and Indian peers nationally do better than African Caribbean Pakistani and Bangladeshi pupils. This variability of attainment does show the inequalities 'are not inevitable' (13) and that 'further changes are possible in the future. [The actual figures show that 26% of White kids got five good grades in 1988 and 44% in 97 and this compares with 17% and 28% for Black kids. Bangladeshi kids recorded 13% and 32%, so a low starting point but a better increase, Indians recorded the best of all increases, and actually exceeded White levels. For Black students the gap narrowed in the latest figures but had still grown overall]. The YCS reports on a sample so it does not offer a perfect picture, especially when divided into different subgroups — the numbers in the subgroups themselves might fluctuate from year to year. Nevertheless, it is only in the most recent example minority ethnic groups have 'experienced an improvement that is greater than that of the White cohort... This evidence of a "closing gap" is encouraging'. However, only Whites and Indian pupils have enjoyed a year-on-year improvement [see my comments above]. Indians did best and have overtaken White peers. The 'most concern'is revealed by the 'growing gap between White pupils and their peers of Black and Pakistani ethnic origins' which means that these groups 'did not enjoy an equal share of the overall improvements recorded in the headline statistics… [And]… Have drawn least benefit from the rising levels of attainment' (14). If we calculate trendlines using regression analysis we can see that there is growing inequality of attainment for African Caribbean and Pakistani pupils. [Assuming nothing improves though, not the assumption they were prepared to make earlier]. One question is whether 'all groups draw equal benefit throughout their time in school'[we know that Black Caribbean boys do not, that they have uneven benefits] There is little school effectiveness research that focuses on ethnic factors, but some of the EMAG data might help to show changing patterns of attainment, even though the data is very patchy and there are no thorough baseline assessments. Only 6 LEA's provided enough detail. Here, Black pupils showed worsening positions between the start and end of compulsory schooling relative to White peers. In one 'large urban authority African Caribbean pupils enter compulsory schooling as the highest achieving group but leave as the group least likely to attain five high-grade GCSEs' (16) and this is based on some of the best data. They declined in each of the relevant key stages, it seems. Another analysis of EMAG data showed a similar relative decline between the ages of 11 and 16 comparing achievement at different key stage English tests, and showing worsening performance between key stage II and four, although they had less reliable data here. Overall, it seems that Afro-Caribbean pupils experience greater inequalities of attainment as they move through the school system, especially 'between the end of primary school and the end of secondary education' (17'. It might be that they're more likely to become alienated from school, but this might be a stereotype. Some research shows that they 'tend to display higher levels of motivation and commitment, enthusiasm for school, rates of attendance and support for homework [references are supplied foot of page 17, all of them refer to the late 1980s one of them is Sewell]. There is a greater encouragement to pursue FE from families and a lot of interest among young people. Instead, 'a good deal of qualitative research' [eg Gillborn and Gipps or Gillborn and Youdell] says that 'Black pupils are often treated more harshly and viewed with low expectations, and that there is something in the way by which schools identify ability and plan decisions like entering for tiered examinations for example. Social class Turning to social class, there is a strong association between social class and success according to DfEE figures — those from the most advantaged backgrounds were 'more than three times as likely' to get five or more higher grade GCSE's 1997. There is some evidence that show the inequality [gap] has grown since the late 1980s, from 40 to 49% between 88 and 97. There are problems in categorising it, and including additional factors such as parental education. Coding can still not be 'routinely computerised in any simple automated way'. Simple definitions include manual and non-manual, or eligibility for free school meals, although this really indicates family poverty. We need to remember that associations between factors do not necessarily indicate causal relationships, nor can we assume that because working class pupils have lagged behind, that the explanation must lie with them, or that reasons lie outside the school. School setting by ability or other forms of selective grouping might have an effect, so might differential teacher expectations and other forms of selection, including teirs in exams. OFSTED argued that differences in attainment between ethnic groups 'remains significant even when taking social class into account', although the data was unreliable, old and crude. The [YCS] material is better, but not perfect. We can now examine class and race, remembering that the sub samples might be quite small. Nevertheless, 'one of the most striking findings is that generally pupils from non-manual backgrounds have significantly higher attainments, as a group, than their peers of the same ethnic origin up from manual households' and 'the familiar association between class and attainment can be seen to operate within each of the main ethnic groups' (19), although social class differences 'are much less pronounced, even reversed in one cohort [only just, in 1990] with African Caribbean pupils. So, 'even when controlling for social class, there remains significant inequalities of attainment between different ethnic groups' [the opposite of what I was about to conclude!] (20). 'Only White pupils improved year on year regardless of their class background', to be contrasted with 'points of relative decline in the attainment of African Caribbean and Pakistani Bangladeshi pupils from both manual and non-manual backgrounds' [I really don't understand this — surely this contradicts the earlier picture of overall improvement — much depends on relative decline I suppose — the figures all show absolute improvement, a bit uneven with Black non-manual and Indian non-manual. I get it — there were SOME points of relative decline]. There are also some interesting exceptions, for example 'in 1988 Black pupils were the most successful of groups from manual backgrounds' so they have experienced a particular relative decline, as have African Caribbean pupils from non-manual backgrounds, and Indian and Pakistani Bangladeshi groups from manual backgrounds [in other words as above with my observations] in the most recent data 'Indian and Pakistani/Bangladeshi pupils from manual backgrounds were at least as successful as Black pupils from non-manual homes'. And overall 'African Caribbean pupils from non-manual homes of the lowest attaining of the middle-class groups… Barely matching the attainments of working class pupils in other ethnic groups' (21). So, class differences appear within each ethnic group. They do not override the influence of ethnic inequality because there are still inequalities of attainment between ethnic groups, and indeed there may be new inequalities of the kind above, affecting even Black pupils from relatively advantaged backgrounds. So we need to target class disadvantage, but not in isolation because if we do we may have 'only a limited effect in closing the gap between particular ethnic groups. As the data demonstrate, new areas of concern are emerging were expected social class differentials are mitigated by the effects of "race" inequality' (21). Gender DfEE data says that the gender gap is increasing [in favour of girls], from 6% in 1989 to more than 10% in 1999 (five or more higher grade GCSEs) factors included new approaches to assessment, teaching and learning, comprehensive schooling, the positive impact of targeted equal opportunities policies, changing notions of masculinity, new attitudes to school and work. There is variation across subject areas and 'considerable differences in entry entertainment patterns' in curriculum areas' (22). There is also sometimes a reversal between GCSE and A-level attainment. Nevertheless a new gender gap favouring girls is a popular topic. Comparing gender gaps with ethnic and social class inequalities show that in 1997, the most recent year for YCS data, five or better grades were attained by 45% of pupils overall: 51% of girls, 42% of boys, but this gender gap 'is considerably smaller than those associated with race and class'. The race gap is 'twice the size', and the results of coming from an unskilled manual home also provides a greater disadvantage. This is a fairly crude comparison because there are variations by social class within ethnic groups, but we do get some idea of the relative scale of inequalities. Gender seems to represent 'the narrowest disparity despite media attention. Gender is therefore 'a less problematic issue' compared to 'the significant disadvantage of race and the even greater inequality of class' [we must be back to overall considerations again]. However, the factors do not operate in isolation. Qualitative research shows that there may well be 'gender specific strategies to resist racism and overcome disadvantage' as when African Caribbean girls do 'relatively well in comparison to their White male and female peers' within local schools. This does not mean that it is only Black boys not girls that face inequalities — there are now gender gaps within each of the principal minority ethnic groups, and inequalities between ethnic groups regardless of pupil gender. Nevertheless, 'in each of the principal ethnic groups nationally, girls are more likely to achieve five higher grade GCSEs than boys the same ethnic origin' (24) and this pattern was established by 1995. This has not overcome differences between ethnic groups, however, these 'persist in comparing groups of pupils of the same sex but with different ethnic origins'. There seems to be a particular 'disadvantage experienced by Pakistani/Bangladeshi and African Caribbean pupils… The girls attained rather higher than their male peers but the gender gap within their groups is insufficient to close the pronounced inequality of attainment associated with their ethnic group as a whole'. Those girls 'do less well than White and Indian girls… [And]… Are also less likely to attain five higher grade GCSEs them White and Indian boys'. We must treat the data with caution, however because sample sizes in YCS shrink dramatically when we take multiple background factors. However some evidence from EMAG support the same trends, for example from one large metropolitan authority. There is a range of variation at the local level, but ethnic inequalities are not confined to a particular gender so when we control for ethnic origin and gender we are left with 'similar patterns to when it was subjected to control by social class. Race and ethnicity remain key defining factors in both cases' [yes but we still cannot say that they are the most important factor in all cases — if there is a single one that qualifies it is social class]. There is still a lack of research addressing three variables together, although the YCS gives us a chance to do so, despite small sample sizes. Here we have to combine Pakistani and Bangladeshi groups and use a twofold model of social class based on manual and non-manual, but even so there are still cases where individual subsamples are less than 30 in size and these values have to be omitted. The figure that results (page 25) shows the relative size of histograms in terms of non-manual and manual groups between 1995 and 1998 for 4 ethnic groups, for boys, and then for girls. 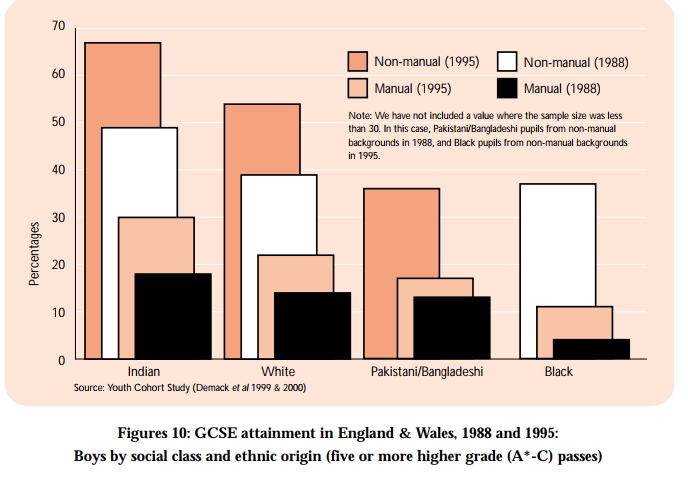 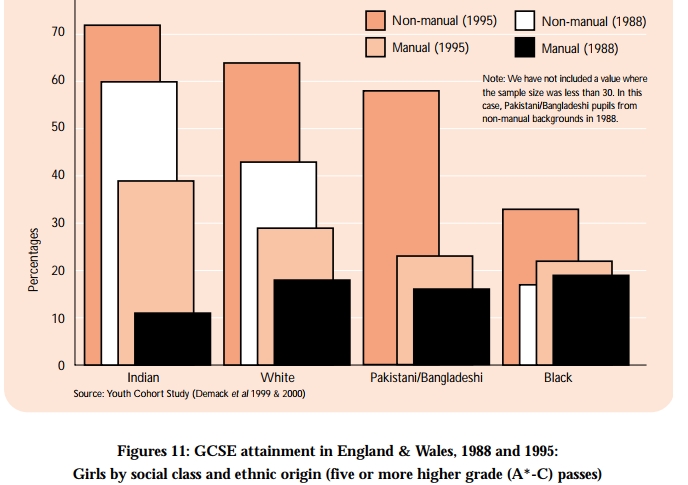 [Their commentary]. Pupils in each category were more likely to have attained five high grade GCSEs in 1995 than they were in 1988 so each group has drawn some benefit. However there is an emerging pattern of ethnic inequalities. If we compare pupils of the same gender and social class background, we can see the Indian pupils did best followed by White, Pakistani/Bangladeshi and Black pupils, although our conclusions can only be 'tentative'. We can also see that 'the gender gap was present within each ethnic group regardless of social class background… Ethnic inequalities persist even when simultaneously controlling for gender and class… When comparing like with like, in terms of gender, class and ethnic origin, consistent and significant ethnic inequalities of attainment remain clear' (26) [I really don't understand the last point — maybe it means take each group in terms of social class and then look at ethnic differences, and then do the same for the tables whether they are boys and girls, and then you will find 'significant' ethnic inequalities. However, these might not be as significant nevertheless as inequalities based on social class?] Broad conclusions are possible: Ethnic inequalities of attainment vary from one area to another but… Distinct patterns of inequality are consistently invisible inequalities of attainment in GCSE Examinations place African Caribbean, Pakistani and Bangladeshi pupils in a disadvantaged position in the youth education, labour, and training markets, and increase the likelihood of social and economic exclusion in later life [ignoring the Indians here which has led to subsequent complaints of fiddling the books] social class and gender differences are also associated with differences in attainment but neither can account for persistent underlying ethnic inequalities: comparing like with like, African Caribbean, Pakistani and Bangladeshi pupils do not enjoy equal opportunities [no Indians again] ethnic inequalities are not new but neither are they static. Evidence shows that in some cases the inequalities of increased in recent years. African Caribbean and Pakistani pupils, for example, have not shared equally in the rising levels of GCSE attainment. So overall the inclusive educational agendas not raise standards for all and we need better policy proposals and practices, better identified strategies. These should focus on: Leadership on equal opportunities and justice from LEAs and schools Schools and LEAs require support and encouragement. There needs to be discussion on how to proceed because there is no real consensus at the moment, and schools clearly have different targets. One particular school aimed at inclusive targets to reduce inequalities of attainment which is in line with the usual dominant approach to equal opportunities, while other L EAs aim at improvement regardless of each group's current position — this might be fair but it 'assumes a very limited understanding of social justice' and 'does nothing to address past inequalities'. Some have set targets that would increase certain inequalities of attainment, by setting targets specifically for White pupils, for example, with adjusted lower ones for African Caribbeans, designed to close the gap with the highest attaining group (Indians). Yet another one aims to improve attainment for all minorities!;p.l;pplo. |